Analyzing Real Estate Listings from Zillow for Market Trends

Today, accessing market analytics is easier than ever. Market trends can help you identify prime times to buy or sell properties, find promising areas for growth, manage risks, and keep constant track of property values. One of the most prominent advantages of modern market analytics is an adapting investment strategy, which traditional investment methods often fail to deliver.

The Social Proxy is one of the fastest-growing API scraper and proxy server providers, built to harness data from the massive internet pool. Our proxy servers are built to hide your IP address and prevent sites from blocking you while you scrape data.
We’ll use these tools to scrape a real estate analytics application called Zillow and integrate the scraping API with proxy servers to create an analytics solution that will continuously fetch data from Zillow without getting detected.

With this continuous stream of market analytics, we’ll demonstrate how to fetch real-time property prices, locations, and essential features that influence future growth, which will then be translated into a color-coded map. This combination will be handy for continuous market research and monitoring valuable information on your customized dashboard.

The importance of analyzing real estate market trends

Before we build our real estate monitoring platform, let’s first understand the importance of extensively analyzing real estate market trends. Here are seven advantages of studying real estate market trends:

  1. Timing purchases and sales
    Analyzing market trends helps investors determine optimal times to buy and sell property. This significantly impacts potential returns on investment, helping to increase them as much as possible.
  2. Identifying promising areas
    Real estate value is based on the area in question and the surrounding region. Market trends reveal the up-and-coming neighborhoods and regions poised for growth, encouraging investors to capitalize on properties with a promising forecast.
  3. Assessing property values
    Market data provides context for property valuations and helps buyers avoid overpaying. Sellers price their properties competitively, optimizing the returns on investment as much as possible.
  4. Forecasting potential returns
    Numbers help forecast prices based on previous valuation. Fusing numerical info with the human experience of investing helps ensure that you invest in the right place or sell for the best price.
  5. Risk management
    Investments backed by solid research grant investors peace of mind, confidence in their decisions, and the ability to manage risks more effectively. The use of computer statistical analysis makes it easy to compute mathematically optimal investment plans. Properly sourced metrics allow investors to take calculated risks instead of educated guesses.
  6. Adapting investment strategies
    By analyzing historical data and facts about various physical parameters of an area, investors can better judge investments and adjust to market conditions. Historical analysis provides better returns in steady markets, but being adaptable is key in real estate. Market trends offer a better way to adapt to situations and constantly improve market awareness.
  7. Development opportunities
    Market trends can help you spot the gaps in supply and emerging demands, exposing you to new projects. Early access to this information can provide an edge in competitive markets.

Understanding market trends through solid analytics provides a clear advantage over other potential investors when it comes to real estate.

Zillow provides information for estates, including homes, open homes, foreclosures, and new constructions for buying and selling. This information includes physical features, interiors, rooms, dimensions, area, and other aspects of property spaces. Zillow also provides details about the property like parking and garages and construction facts like conditions and materials. Furthermore, utility and finance information like annual tax amounts provide a thorough property analysis.

With all this information, including numerical metrics and factual statements, you can use The Social Proxy to create a customized dashboard to monitor these metrics on Zillow.


Introduction to Zillow scraping and data collection

Zillow is the #1 ranking real estate application with three times more traffic than its competitors. It’s become one of the most popular and influential platforms in the real estate industry in the United States. One of Zillow’s best features is the extensive information it provides about properties, which contributes to the evaluation of both physical parameters as well as numerical metrics that are important to consider when value investing. For our real estate market analysis, we’ll use Zillow to scrape data and fetch analytics.

The Social Proxy provides mobile and residential proxies per the user’s requirements. Mobile proxies use IP addresses associated with mobile devices and cellular networks. They are dynamic and highly anonymous, allowing you to access the information (in our case, Zillow) without getting blocked. We also provide residential proxies with IPs assigned by Internet Service Providers (ISPs) to homeowners and other residential users. They appear highly legitimate, have stable connections, are faster, and have diverse locations.

These proxies are so powerful that we can scrape data from Zillow without detection or downtime due to blocking. With rotating proxies, each time the scraper accesses Zillow, the IP changes, leaving it unsuspected. These proxies make it possible to extract a lot of information.

Setting up the scraper for Zillow data collection

Let’s start out by building our custom scraper for Zillow. We’ll write it in Python because of its simple syntax, which is accessible to all. Feel free to implement your scraper in any language. We’ll explore the endpoints from which we can fetch data and parts of the website from which we can scrape valuable information. For this example, we’ll look at residential properties.

Head over to Zillow. Click “Buy”.

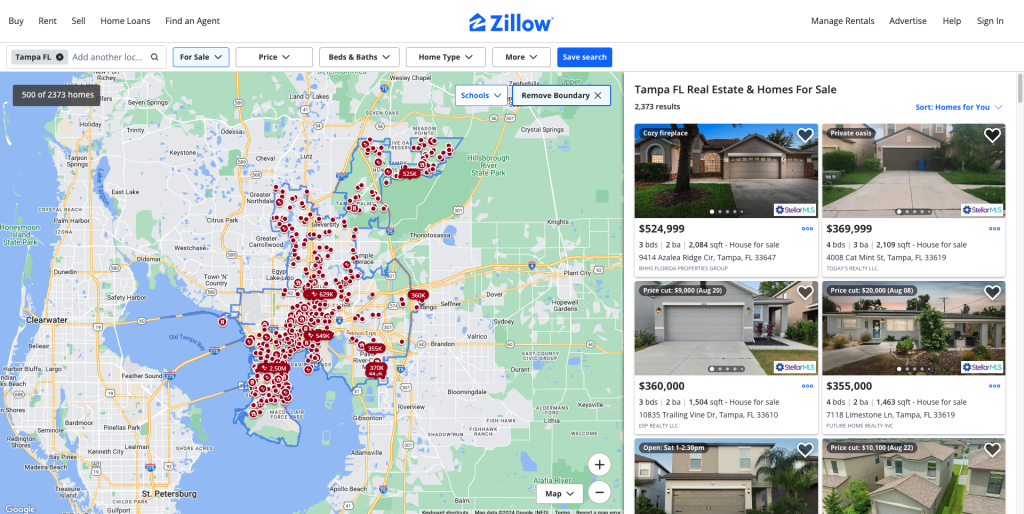
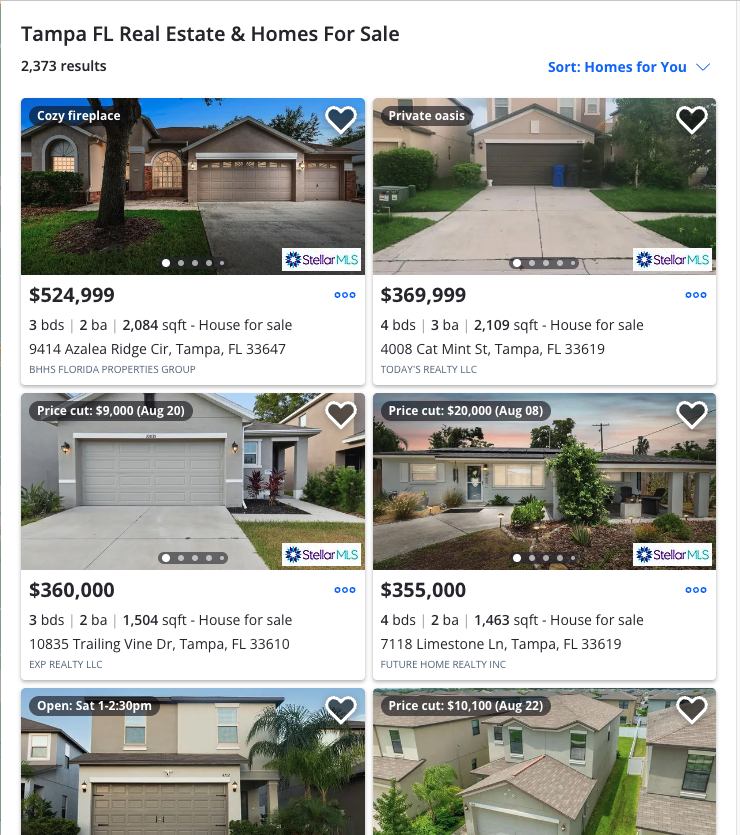
This is the endpoint where all property listings are made. We are interested in the cards in which properties are listed. They contain information like pricing, physical facts, and developer tools in your browser.

To open the developer tools in your browser, click on the three dots at the rightmost corner. Select “More Tools,” then “Developer Tools.” This will give you access to the web page’s source code.

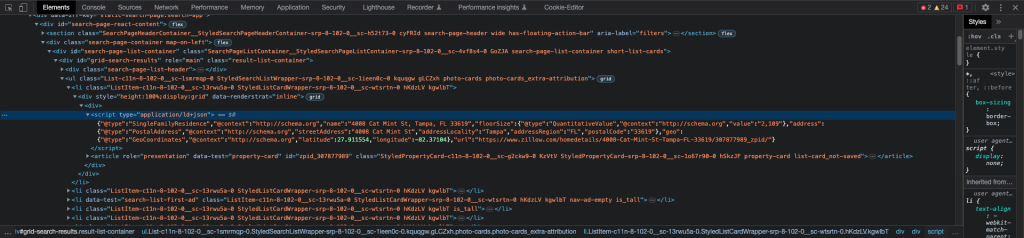
Hover around one of the cards in the above properties, right-click, and select “Inspect Element.” This will show you exactly where the building blocks of those elements are present. As shown in the figure, you will find data in JSON format, specifically in the <script> (script) tag, with type=”application/ld+json.”

Now we have the data source ready to be scraped for one property! These scripts are inside the <li> (list) tags.

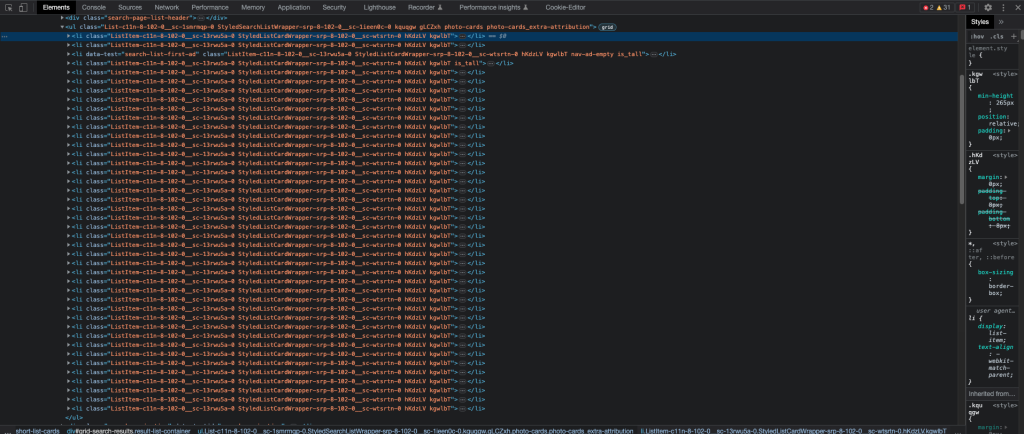
Zooming out, some tags listed may contain JSON data that possess valuable information about the properties.

Now that we’ve found the data source, we need to automate the scraping. To do so, we’ll use Selenium. Selenium is a powerful web automation toolkit for automating web application testing, scraping, and much more.

First, we’ll import some necessary packages required for Selenium to work, as well as some utilities that we’ll need:

				
					from selenium import webdriver
from selenium.webdriver.support.ui import WebDriverWait
from selenium.webdriver.chrome.service import Service
from selenium.webdriver.support import expected_conditions as EC
from selenium.webdriver.common.by import By
from webdriver_manager.chrome import ChromeDriverManager
from selenium.webdriver.chrome.options import Options
from selenium.common.exceptions import TimeoutException
import json


Now, we can move on to the critical part of implementing a proxy. A proxy service allows us to hide our IP address and keep changing it to avoid detection. These proxy servers are based in different locations, enabling us to access geo-restricted services on the internet.

Zillow is a popular real estate site with millions of users, securing and preventing bots from surfing their sites. On top of that, Zillow uses custom CAPTCHA, which cannot be bypassed with traditional bypass mechanisms against CAPTCHAs. We’ll use The Social Proxy’s residential proxies to make our traffic look legitimate and less automated. These proxies possess IP addresses assigned to residential customers, which applications like Zillow consider legitimate.

To configure the proxy with our Python code, we’ll define a few variables:

				
					# Proxy configuration (same as before)
proxy_address = "residential.thesocialproxy.com"
proxy_port = "10000"
proxy_url = f"http://{proxy_address}:{proxy_port}"


You can get your residential proxy from The Social Proxy’s official website.

We’ll configure our browser and set up the driver to automate our scraping process.

				
					# Configure Chrome options (same as before)
chrome_options = Options()
chrome_options.add_argument(f'--proxy-server={proxy_url}')
# Initialize the WebDriver (same as before)
service = Service(ChromeDriverManager().install())
driver = webdriver.Chrome(service=service, options=chrome_options)
# Open Zillow search page
driver.get("https://www.zillow.com/homes/for_sale/")
# Wait for the search results to load
wait = WebDriverWait(driver, 20)


In this case, we’ll use the Chrome browser. First, we create an Options() object and specify it with the proxy URL we crafted before. Next we’ll create a service with Chrome Driver Manager and then we can make the driver, specifying the service and Chrome options.

Eventually, we’ll be returned to the web page and create a waiting variable for the driver to wait for the search results to load with a 20 second timeout.

				
					try:
    wait.until(EC.presence_of_element_located((By.ID, "grid-search-results")))
except TimeoutException:
    print("Timeout waiting for search results to load")
    driver.quit()
    exit()


In the try-except statement in Python, we wait for the “grid-search-results” ID to be found on the webpage. When the element is rendered, this code will either continue or create a TimeoutException and quit the driver.

Finally, we can parse the data from the webpage. First, we define a function for extracting JSON-LD data as per the location of the data source in developer tools. After that, we find all the script elements since multiple script tags contain data about a property.

We then iteratively go through all the script elements, extract the JSON-LD data, and store it in a list printed at the program’s end. Finally, we’ll quit the driver and end our scraper program.

				
					# Function to extract and parse JSON-LD data
def extract_json_ld(script_element):
    try:
        json_content = script_element.get_attribute('innerHTML')
        return json.loads(json_content)
    except json.JSONDecodeError:
        return None
# Find all script tags with JSON-LD data
script_elements = driver.find_elements(By.XPATH, '//script[@type="application/ld+json"]')
# Extract and store the data
property_data = []
for script in script_elements:
    data = extract_json_ld(script)
    if data and data.get("@type") == "SingleFamilyResidence":
        property_data.append(data)
# Print the extracted data
for prop in property_data:
    print(json.dumps(prop, indent=2))
# Close the browser
driver.quit()


Once you execute this program, a browser will spawn. It will ask for your username, password, and proxy authentication. These details are provided in The Social Proxy’s dashboard. The program will then automate scrape data from the web page and print it on the terminal.

Here is an example of how the data looks:

				
					{
  "@type": "SingleFamilyResidence",
  "@context": "http://schema.org",
  "name": "808 E Frierson Ave, Tampa, FL 33603",
  "floorSize": {
    "@type": "QuantitativeValue",
    "@context": "http://schema.org",
    "value": "1,344"
  },
  "address": {
    "@type": "PostalAddress",
    "@context": "http://schema.org",
    "streetAddress": "808 E Frierson Ave",
    "addressLocality": "Tampa",
    "addressRegion": "FL",
    "postalCode": "33603"
  },
  "geo": {
    "@type": "GeoCoordinates",
    "@context": "http://schema.org",
    "latitude": 27.994516,
    "longitude": -82.45241
  },
  "url": "https://www.zillow.com/homedetails/808-E-Frierson-Ave-Tampa-FL-33603/45092658_zpid/"
}


Note that this is just one JSON object; on the terminal, however, multiple will appear, each representing information about a single property. For the sake of explanation, we’ll reference just one object.

Scraping Zillow multiple times with your local IP will lead to getting blocked by Zillow. However, if you use a proxy from The Social Proxy, your IP will not be revealed, and the proxy will keep changing the IP to avoid detection. Zillow is very sensitive to bots and has a complex CAPTCHA mechanism, which is out of the scope of this article to bypass. The Social Proxy’s residential proxy can be used to avoid them since its IPs appear authentic and Zillow doesn’t suspect them to be bots.

Analyzing and visualizing the collected data

Note that this is just one JSON object; on the terminal, however, multiple will appear, each representing information about a single property. For the sake of explanation, we’ll reference just one object.

Scraping Zillow multiple times with your local IP will lead to getting blocked by Zillow. However, if you use a proxy from The Social Proxy, your IP will not be revealed, and the proxy will keep changing the IP to avoid detection. Zillow is very sensitive to bots and has a complex CAPTCHA mechanism, which is out of the scope of this article to bypass. The Social Proxy’s residential proxy can be used to avoid them since its IPs appear authentic and Zillow doesn’t suspect them to be bots.

				
					import matplotlib.pyplot as plt
import seaborn as sns


Then we move on to write the code used for graphing the metrics. First we set the style to a dark background and create lists of coordinates—for example, floor sizes, regions, and locations. For the sake of simplicity, we’ll keep these parameters. Feel free to scrape and visualize as much data as you need. 

Next we’ll plot the data points. This is nearly boilerplate code and includes setting labels, plots, titles, types of plots, etc. The code below refers to this. For more information, refer to the Matplotlib docs.  

				
					sns.set_theme(style="whitegrid")
plt.style.use('dark_background')
# Extract relevant data for plotting
floor_sizes = [int(prop['floorSize']['value'].replace(',', '')) for prop in property_data]
latitudes = [prop['geo']['latitude'] for prop in property_data]
longitudes = [prop['geo']['longitude'] for prop in property_data]
regions = [prop['address']['addressRegion'] for prop in property_data]
# Plot 1: Distribution of Floor Size
plt.figure(figsize=(10, 6))
sns.histplot(floor_sizes, bins=10, kde=True, color='skyblue')
plt.title('Distribution of Floor Sizes', fontsize=16, color='white')
plt.xlabel('Floor Size (sq ft)', fontsize=14, color='white')
plt.ylabel('Number of Properties', fontsize=14, color='white')
plt.show()
# Plot 2: Property Locations on a Map (Scatter Plot)
plt.figure(figsize=(10, 6))
sns.scatterplot(x=longitudes, y=latitudes, marker='o', color='cyan')
plt.title('Property Locations', fontsize=16, color='white')
plt.xlabel('Longitude', fontsize=14, color='white')
plt.ylabel('Latitude', fontsize=14, color='white')
plt.show()
# Plot 3: Frequency of Properties by Region (Bar Chart)
region_counts = {region: regions.count(region) for region in set(regions)}
plt.figure(figsize=(10, 6))
sns.barplot(x=list(region_counts.keys()), y=list(region_counts.values()), palette='cool')
plt.title('Number of Properties by Region', fontsize=16, color='white')
plt.xlabel('Region', fontsize=14, color='white')
plt.ylabel('Number of Properties', fontsize=14, color='white')
plt.xticks(rotation=45, color='white')
plt.yticks(color='white')
plt.show()


Once you run this code, the scraper will fetch the data from Zillow and generate a visual in the form of a graph. See examples below:

These visuals can be stored in a database for future reference. This script can also be modified to run as a cron job and fetch data in time intervals. The data can be stored in the form of numbers in databases and software can be implemented to compile all the data and generate visuals like these. Limitless things can be done with the help of these scrapers and proxies by The Social Proxy, taking the real estate investment to the next level.

Conclusion

Such a robust market analysis has its place in real estate investments. Conducting mathematical analysis and harnessing the power of statistics, artificial intelligence, probability, etc., require vast amounts of numerical data. The Social Proxy provides a Scraping API for Zillow, empowering you to integrate this valuable data into any form you want.

As we reviewed in this blog, you can customize data by integrating it into color-coded visualizers, analysis, and graphing tools. Data visualization can aid your decision-making process, helping you navigate all the tedious metrics and make the most optimal investment approach.

Add analytics and metrics to your investment journey with The Social Proxy. Elevate your investment strategy with systematic calculations to become more confident in your decisions and manage your risk better than ever. Sign up for The Social Proxy today and enjoy the benefits of on-demand scraping and proxy APIs.

Accessibility tools

Powered by - Wemake